| technical stuff |
Night Sky at Observatory
.jpg) |
| Shown is an image of a moonless night sky over Observatorio Bajo Las Estrellas on June 19, 2012 at 2:00 AM. The image was taken with a Moonglow Technologies All Sky Cam. The light dome in the southeast is Tucson. The faint light dome in the northwest is probably Phoenix. The Milky Way is visible despite these light domes. The sky brightness at the zenith on a moonless night is 20.5 magnitudes/square arc-sec (see below). |
.jpg) |
.jpg) |
.jpg) |
.jpg) |
| Shown is an image of M1 taken at my observatory on February 22, 2011 (top left). It was constructed from 12 x 10 min luminance frames and a varying number of 10 min red, green and blue frames (click here for details). To assess the quality of the sky, I measured the brightness of the background sky and sharpness of the stars using one of the 10 min luminance frames. The first measurement (sky brightness) reflects the amount of local light pollution and determines the lower limit (faintness) of what you can image (and see). The second measurement (star sharpness) reflects the steadiness of the air and determines the level of detail (resolution) that you can image (and see). Steady, transparent air and dark skies are ideal for imaging and observing. As shown in the top right image (M1 was 68 degrees above the western horizon and the moon had not risen yet), the background sky flux was 1,050 analog-to-digital units (ADU) after subtracting the 100 ADU pedestal that the program adds, which corresponds to 1.4 electrons (e) per second (s) (CCD camera gain = 0.79 e/ADU). The sky brightness at the zenith on a moonless night is ~1.0 e/s or 20.5 magnitudes/square arc-sec [see here (large file) and below]. For comparison, the background sky flux is ~0.7 e/s at Kitt Peak, and ~0.3 e/s at New Mexico Skies. The sharpness of the stars is determined by measuring their full-width-half-maximum (FWHM), which reflects how quickly the pixel intensity declines when moving away from the star's center. In a perfect world, all of the starlight should fall on a single pixel since the source is very far away and, therefore, a point source of light. In reality, however, the starlight is spread over several neighboring pixels due to turbulence in the earth's atmosphere, and less than perfect polar alignment of the mount, autoguiding, and focus. The FWHM of a star just below the nebula is 1.85 arc-sec (bottom two images), which is excellent. This result is even more impressive considering it was determined with a 10 min exposure. Longer exposures typically result in "bloated" stars and a higher FWHM due to the factors mentioned above. Obviously, the autoguiding was outstanding that night (click here). Hence, the sky conditions at my observatory are pretty good. The sky is relatively dark (about 4.5 on the Bortle scale), and the air is dry and stable once the heat leaves the Sonoran desert. The only drawback is a light dome above the southeastern horizon (click here). |
.jpg) |
| Shown are master luminance frames of NGC 3628 taken at my observatory (left) and New Mexico Skies (right) with my 12.5" Ritchey-Chretien. New Mexico Skies is an observatory in Mayhill, New Mexico that has some of the darkest/clearest skies in the United States. The image on the left is a mean combine of 12 x 10 min frames. The image on the right is a mean combine of 2 x 15 min frames. The signal-to-noise ratio (SNR) is better in the left image (3,175 vs 1,130), albeit it was generated from a greater number of individual frames (but less time per frame) thereby improving the SNR 2-fold relative to the right image. Close inspection of the image on the right shows significant noise, probably because the exposure time was too short given the dark skies and too few frames were taken (see "Determination of Subexposure Time" below). As expected, the sky brightness (Bkd) at my observatory is 3- to 4-fold greater than at New Mexico skies (see here). Nevertheless, the skies at my observatory are pretty good and I can acquire images with nearly the same quality as those taken at one of the darkest/clearest sites in the US. |
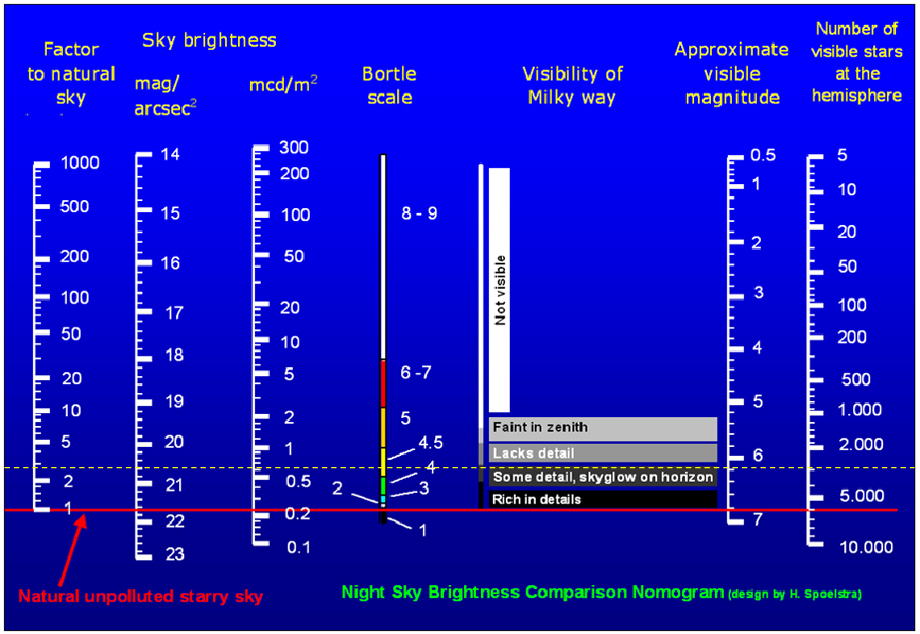 |
| Shown is a night sky brightness nomogram (courtesy of H Spoelstra). The night sky brightness during a New Moon at Observatorio Bajo Las Estrellas is shown by the dashed white line. |
.jpg) |
| Shown is a plot of the night sky brightness vs altitude during a new moon at Observatorio Bajo Las Estrellas. The data were generated using 58 calibrated luminance frames (20 min each) starting from 33 degrees above the eastern horizon, through the meridian, to 50 degrees above the western horizon. The altitude when crossing the meridian was 86 degrees. |
12.5" Ritchey-Chretien Collimation and Field Curvature
.jpg) |
%20of%20M1%20Image%20004L%20(1200%20x%20800,%2002-22-11).jpg) |
| Using the same luminance frame of M1 (see above), I assessed the telescope's collimation and field curvature with CCD Inspector v2. Collimation reflects how well the telescope's optical and physical axes are aligned. The better the collimation, the sharper the image. Field curvature reflects the sharpness (FWHM) of stars over the field of view (FOV). Most telescopes have field curvature because the focal plane of the optical system is curved, which presents a problem when the detector (i.e., CCD chip) is flat. A small field curvature (or flatter field) results in more stars being in focus over the FOV and, hence, better images. A large field curvature typically results in stars in the middle being in focus while those near the corners being out of focus. The telescope was only 0.9 arc-sec out of perfect collimation (left), which is outstanding. The field curvature was 33% (right), which is significant (and undesirable) and characteristic of the Ritchey-Chretien design. The colors represent the different levels of focus with black being the best, followed by blue, green, red. Inspection of the M1 image (above, top left) shows that the stars at the corners are elongated (a phenomenon called astigmatism), which is characteristic of the Ritchey-Chretien design. |
Determination of Subexposure Time
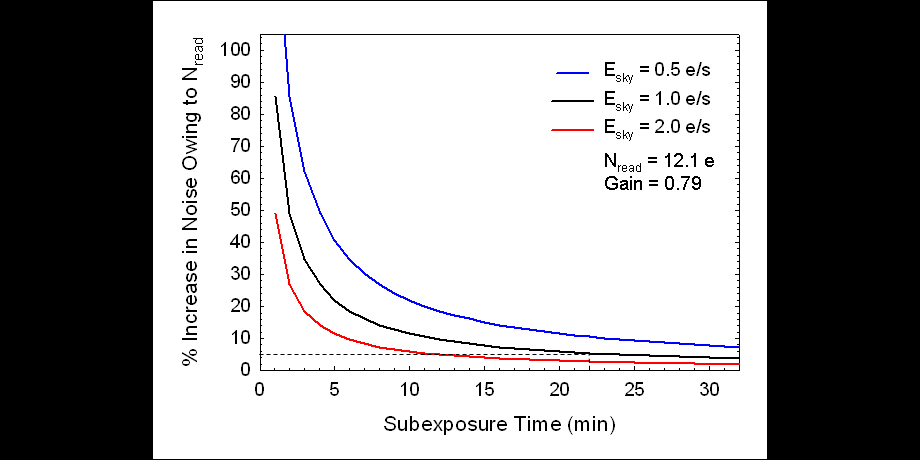 |
| John Smith and Steve Cannistra have posted nice discussions on their websites regarding how to determine the minimum subexposure time given your skies and CCD equipment. To summarize, you want to expose for a sufficient length of time so the background sky flux (Esky, or shot noise) overwhelms the read noise (Nread) of the CCD camera. Read noise is a fundamental trait of CCD cameras and is caused by the camera's electronics. A reasonable target exposure is when Nread increases the overall noise by ≤ 5%. Dark skies require long exposure times for Esky to overwhelm Nread whereas light-polluted skies require shorter exposure times (one small advantage of light-polluted skies). To determine the minimum subexposure time, the camera gain, Nread, and Esky must be determined first. The measured gain and Nread of my two CCD cameras are: STX16803- gain = 1.31 e/ADU, read noise = 11.21 e; STL11000M- gain = 0.79 e/ADU, read noise = 12.1 e (click here and here). These values agree well with those published by SBIG. At my observatory, Esky is typically 1.0 to 2.0 e/s depending on the time of night, target altitude, and moon. Once these parameters are determined, the subexposure time as a function of the contribution of Nread to the noise level can be calculated using the equations provided on John's and Steve's websites. The equations assume that dark noise is negligible following dark frame calibration, and the light flux from the object (Eobj) you're imaging is negligible relative to Esky. Shown above is a plot of the subexposure time versus how much Nread increases the noise level at various values of Esky (using STL1000M data). Depending on the sky background on a given night, I need to expose for 12 - 22 min for Nread to increase the noise level by ≤ 5% (dotted lines). The signal-to-noise ratio (SNR) can be improved by combining (i.e., averaging) individual frames. SNR increases with the square root of the number of frames. As discussed in John Smith's excellent paper (click here), reducing the subexposure time to half the calculated minimum and increasing the number of frames to 2n + 1, where n is the number of frames normally taken at the minimum subexposure time, is a good strategy to minimuze random and non-random noise. Hence, you should expose as long as you can given your sky conditions and autoguiding capabilities, and take many frames. Dithering between frames and applying appropriate data rejection algorithms before combining frames reduces noise further. |
Periodic Error of Paramount ME
 |
| Periodic error (PE) is repeatable error in the mount due to imperfections in the RA worm gears. Because it is repeatable and, therefore, predictable, it can be measured and corrected using software. I measured the PE of my Paramount ME without periodic error correction (PEC) enabled in TheSky6 (red line) and after correcting it with PEMPro v2 (blue line). The PE without PEC enabled was 1.42 arc-sec peak-to-peak, which is quite good, and improved to 1.02 arc-sec peak-to-peak after uploading the new PEC table to the mount (left). I then analyzed the quality of the autoguiding while locked on a star at Dec = 0.0 just west of the meridian. Ninety-five percent (mean ± 2 x STDs) of the RA autoguiding errors were < 1.0 arc-sec or < 2.0 arc-sec peak-to-peak (right). Red line, mean; blue lines, ± 2 x STD. |
Pointing Error of Paramount ME
.jpg) |
| The pointing error of my Paramount ME was determined on 10-26-13 after a TPoint mapping run. Methods- The telescope was slewed to 35 stars around the celestial sphere and a one second image was taken without centering the star. The 35 frames were then merged. The image above shows where the 35 stars fell on the CCD chip. The blue circles are multiples of 5.0 arc-min in diameter. The centroid of each star was determined with MaxImDL and its offset from center (in arc-min) was calculated. Results- The median (and mean) pointing error was 2.7 arc-min. Seventeen of 35 (49%) stars fell on or within 2.5 arc-min, and 32 of 35 (91%) stars fell on or within 5.0 arc-min, of center. Also shown is the TPoint scatter diagram. The root mean square (RMS) of the pointing error is approximately 80 arc-sec. Hence, the pointing error is very good. |